Experience goes a long way, but sometimes you need to be more precise about what size of lighting instruments are required for a particular scene. Night exteriors, for example; you don’t want to find out on the day that the HMI you hired as your “moon” backlight isn’t powerful enough to cover the whole of the car park you’re shooting in. How can you prep correctly so that you don’t get egg on your face?
There are two steps: 1. determine the intensity of light you require on the subject, and 2. find a combination of light fixture and fixture-to-subject distance that will provide that intensity.
The Required intensity
The goal here is to arrive at a number of foot-candles (fc). Foot-candles are a unit of light intensity, sometimes more formally called illuminance, and one foot-candle is the illuminance produced by a standard candle one foot away. (Illuminance can also be measured in the SI unit of lux, where 1 fc ≈ 10 lux, but in cinematography foot-candles are more commonly used. It’s important to remember that illuminance is a measure of the light incident to a surface, i.e. the amount of light reaching the subject. It is not to be confused with luminance, which is the amount of light reflected from a surface, or with luminous power, a.k.a. luminous flux, which is the total amount of light emitted from a source.)
Usually you start with a T-stop (or f-stop) that you want to shoot at, based on the depth of field you’d like. You also need to know the ISO and shutter interval (usually 1/48th or 1/50th of a second) you’ll be shooting at. Next you need to convert these facets of exposure into an illuminance value, and there are a few different ways of doing this.
One method is to use a light meter, if you have one, which you enter the ISO and shutter values into. Then you wave it around your office, living room or wherever, pressing the trigger until you happen upon a reading which matches your target f-stop. Then you simply switch your meter into foot-candles mode and read off the number. This method can be a bit of a pain in the neck, especially if – like mine – your meter requires fiddly flipping of dip-switches and additional calculations to get a foot-candles reading out of.
A much simpler method is to consult an exposure table, like the one below, or an exposure calculator, which I’m sure is a thing which must exist, but I’ll be damned if I could find one.
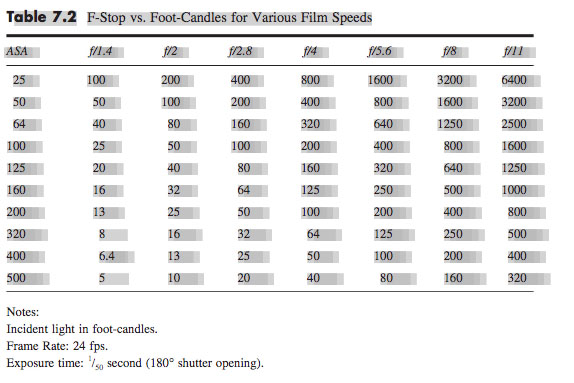
Some cinematographers memorise the fact that 100fc is f/2.8 at ISO 100, and work out other values from that. For example, ISO 400 is four times (two stops) faster than ISO 100, so a quarter of the light is required, i.e. 25fc.
Alternatively, you can use the underlying maths of the above methods. This is unlikely to be necessary in the real world, but for the purposes of this blog it’s instructive to go through the process. The equation is:

where
- b is the illuminance in fc,
- f is the f– or T-stop,
- s is the shutter interval in seconds, and
- i is the ISO.
Say I’m shooting on an Alexa with a Cooke S4 Mini lens. If I have the lens wide open at T2.8, the camera at its native ISO of 800 and the shutter interval at the UK standard of 1/50th (0.02) of a second…
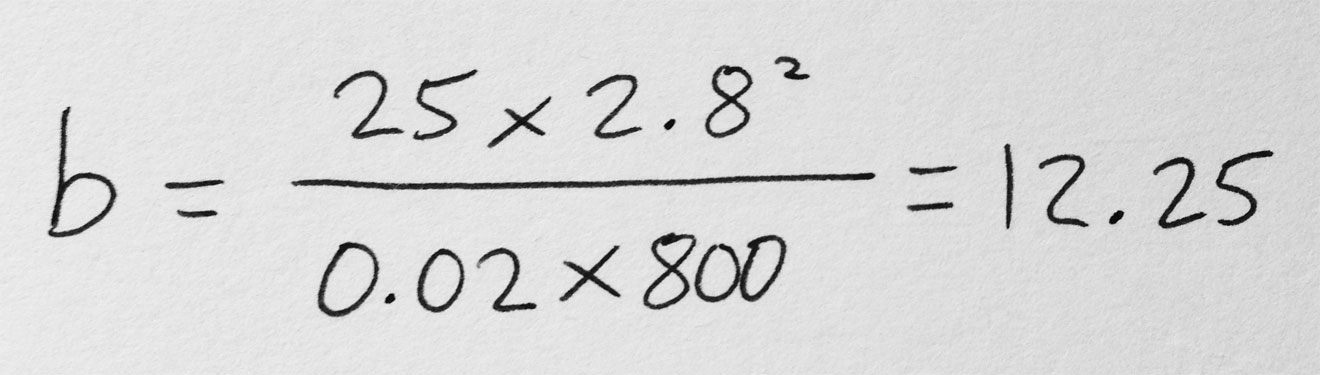
… so I need about 12fc of light.
The right instrument
In the rare event that you’re actually lighting your set with candles – as covered in my Barry Lyndon and Stasis posts – then an illuminance value in fc is all you need. In every other situation, though, you need to figure out which electric light fixtures are going to give you the illuminance you need.
Manufacturers of professional lighting instruments make this quite easy for you, as they all provide data on the illuminance supplied by their products at various distances. For example, if I visit Mole Richardson’s webpage for their 1K Baby-Baby fresnel, I can click on the Performance Data table to see that this fixture will give me the 12fc (in fact slightly more, 15fc) that I required in my Alexa/Cooke example at a distance of 30ft on full flood.
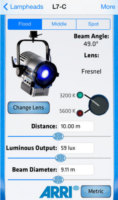
Other manufacturers provide interactive calculators: on ETC’s site you can drag a virtual Source Four back and forth and watch the illuminance read-out change, while Arri offers a free iOS/Android app with similar functionality.
If you need to calculate an illuminance value for a distance not specified by the manufacturer, you can derive it from distances they do specify, by using the Inverse Square Law. However, as I found in my investigatory post about the law, that could be a whole can of worms.
If illuminance data is not available for your light source, then I’m afraid more maths is involved. For example, the room I’m currently in is lit by a bulb that came in a box marked “1,650 lumens”, which is the luminous power. One lumen is one foot-candle per square foot. To find out the illuminance, i.e. how many square feet those lumens are spread over, we imagine those square feet as the area of a sphere with the lamp at the centre, and where the radius r is the distance from the lamp to the subject. So:

where
- b is again the illuminance in fc,
- p is the luminous power of the souce in lumens, and
- r is the lamp-to-subject distance in feet.
(I apologise for the mix of Imperial and SI units, but this is the reality in the semi-Americanised world of British film production! Also, please note that this equation is for point sources, rather than beams of light like you get from most professional fixtures. See this article on LED Watcher if you really want to get into the detail of that.)
So if I want to shoot that 12fc scene on my Alexa and Cooke S4 Mini under my 1,650 lumen domestic bulb…

… my subject needs to be 3’4″ from the lamp. I whipped out my light meter to check this, and it gave me the target T2.8 at 3’1″ – pretty close!
Do I have enough light?
If you’re on a tight budget, it may be less a case of, “What T-stop would I like to shoot at, and what fixture does that require?” and more a case of, “Is the fixture which I can afford bright enough?”
Let’s take a real example from Perplexed Music, a short film I lensed last year. We were shooting on an Alexa at ISO 1600, 1/50th sec shutter, and on Arri/Zeiss Ultra Primes, which have a maximum aperture of T1.9. The largest fixture we had was a 2.5K HMI, and I wanted to be sure that we would have enough light for a couple of night exteriors at a house location.
In reality I turned to an exposure table to find the necessary illuminance, but let’s do the maths using the first equation that we met in this post:

Loading up Arri’s photometrics app, I could see that 2.8fc wasn’t going to be a problem at all, with the 2.5K providing 5fc at the app’s maximum distance of 164ft.
That’s enough for today. All that maths may seem bewildering, but most of it is eliminated by apps and other online calculators in most scenarios, and it’s definitely worth going to the trouble of checking you have enough light before you’re on set with everyone ready to roll!
See also: 6 Ways of Judging Exposure
 You can use data supplied by the lamp manufacturer to calculate the exposure it will provide, which is very useful in preproduction when deciding what size of lamps you need to hire. There are apps for this, such as the
  Some believe that light meters are unnecessary in today’s digital landscape, but I disagree. Most of the methods listed below require the camera, but the camera may not always be handy – on a location recce, for example. Or during production, it would be inconvenient to interrupt the ACs while they’re rigging the camera onto a crane or Steadicam. This is when having a light meter on your belt becomes very useful.
 Now we move along the light path and consider light after it has been reflected off the subject. This is what a spot meter measures. It has a viewfinder with which you target the area you want to read, and it is capable of metering things that would be impractical or impossible to measure with an incident meter. If you had a bright hillside in the background of your shot, you would need to drive over to that hill and climb it to measure the incident light; with a spot meter you would simply stand at the camera position and point it in the right direction. A spot meter can also be used to measure light sources themselves: the sky, a practical lamp, a flame and so on.
 Your smartphone can be turned into a spot meter with a suitable app, such as
 A waveform plots luminance on the vertical axis, with the horizontal axis matching the horizontal position of those luminance values within the frame. The density of the plotting reveals the prevalence of the values. A waveform that was dense in the bottom left, for example, would indicate a lot of dark tones on the lefthand side of frame. Since the vertical (luminance) axis represents IRE (Institute of Radio Engineers) values, waveforms are ideal when you need to expose to a given IRE, for example when calibrating a system by shooting a grey card. Another common example would be a visual effects supervisor requesting that a green screen be lit to 50 IRE.