Exposing the image correctly is one of the most important parts of a cinematographer’s job. Choosing the T-stop can be a complex technical and creative decision, but fortunately there are many ways we can measure light to inform that decision.
First, let’s remind ourselves of the journey light makes: photons are emitted from a source, they strike a surface which absorbs some and reflects others – creating the impressions of colour and shade; then if the reflected light reaches an eye or camera lens it forms an image. We’ll look at the various ways of measuring light in the order the measurements occur along this light path, which is also roughly the order in which these measurements are typically used by a director of photography.
1. Photometrics data
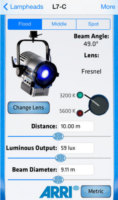 You can use data supplied by the lamp manufacturer to calculate the exposure it will provide, which is very useful in preproduction when deciding what size of lamps you need to hire. There are apps for this, such as the Arri Photometrics App, which allows you to choose one of their fixtures, specify its spot/flood setting and distance from the subject, and then tells you the resulting light level in lux or foot-candles. An exposure table or exposure calculation app will translate that number into a T-stop at any given ISO and shutter interval.
2. Incident meter
 Some believe that light meters are unnecessary in today’s digital landscape, but I disagree. Most of the methods listed below require the camera, but the camera may not always be handy – on a location recce, for example. Or during production, it would be inconvenient to interrupt the ACs while they’re rigging the camera onto a crane or Steadicam. This is when having a light meter on your belt becomes very useful.
An incident meter is designed to measure the amount of light reaching the subject. It is recognisable by its white dome, which diffuses and averages the light striking its sensor. Typically it is used to measure the key, fill and backlight levels falling on the talent. Once you have input your ISO and shutter interval, you hold the incident meter next to the actor’s face (or ask them to step aside!) and point it at each source in turn, shading the dome from the other sources with your free hand. You can then decide if you’re happy with the contrast ratios between the sources, and set your lens to the T-stop indicated by the key-light reading, to ensure correct exposure of the subject’s face.
3. Spot meter (a.k.a. reflectance meter)
 Now we move along the light path and consider light after it has been reflected off the subject. This is what a spot meter measures. It has a viewfinder with which you target the area you want to read, and it is capable of metering things that would be impractical or impossible to measure with an incident meter. If you had a bright hillside in the background of your shot, you would need to drive over to that hill and climb it to measure the incident light; with a spot meter you would simply stand at the camera position and point it in the right direction. A spot meter can also be used to measure light sources themselves: the sky, a practical lamp, a flame and so on.
But there are disadvantages too. If you spot meter a Caucasian face, you will get a stop that results in underexposure, because a Caucasian face reflects quite a lot of light. Conversely, if you spot meter an African face, you will get a stop that results in overexposure, because an African face reflects relatively little light. For this reason a spot meter is most commonly used to check whether areas of the frame other than the subject – a patch of sunlight in the background, for example – will blow out.
 Your smartphone can be turned into a spot meter with a suitable app, such as Cine Meter II, though you will need to configure it using a traditional meter and a grey card. With the addition of a Luxiball attachment for your phone’s camera, it can also become an incident meter.
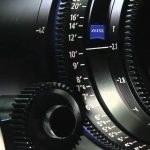
The remaining three methods of judging exposure which I will cover all use the camera’s sensor itself to measure the light. Therefore they take into account any filters you’re using as well transmission loss within the lens (which can be an issue when shooting on stills glass, where the marked f-stops don’t factor in transmission loss).
4. Monitors and viewfinders

In the world of digital image capture, it can be argued that the simplest and best way to judge exposure is to just observe the picture on the monitor. The problem is, not all screens are equal. Cheap monitors can misrepresent the image in all kinds of ways, and even a high-end OLED can deceive you, displaying shadows blacker than any cinema or home entertainment system will ever match. There are only really two scenarios in which you can reliably judge exposure from the image itself: if you’ve owned a camera for a while and you’ve become very familiar with how the images in the viewfinder relate to the finished product; or if the monitor has been properly calibrated by a DIT (Digital Imaging Technician) and the screen is shielded from light.
Most cameras and monitors have built-in tools which graphically represent the luminance of the image in a much more accurate way, and we’ll look at those next. Beware that if you’re monitoring a log or RAW image in Rec.709, these tools will usually take their data from the Rec.709 image.
5. Waveforms and histograms
These are graphs which show the prevalence of different tones within the frame. Histograms are the simplest and most common. In a histogram, the horizontal axis represents luminance and the vertical axis shows the number of pixels which have that luminance. It makes it easy to see at a glance whether you’re capturing the greatest possible amount of detail, making best use of the dynamic range. A “properly” exposed image, with a full range of tones, should show an even distribution across the width of the graph, with nothing hitting the two sides, which would indicate clipped shadows and highlights. A night exterior would have a histogram crowded towards the left (darker) side, whereas a bright, low contrast scene would be crowded on the right.
 A waveform plots luminance on the vertical axis, with the horizontal axis matching the horizontal position of those luminance values within the frame. The density of the plotting reveals the prevalence of the values. A waveform that was dense in the bottom left, for example, would indicate a lot of dark tones on the lefthand side of frame. Since the vertical (luminance) axis represents IRE (Institute of Radio Engineers) values, waveforms are ideal when you need to expose to a given IRE, for example when calibrating a system by shooting a grey card. Another common example would be a visual effects supervisor requesting that a green screen be lit to 50 IRE.
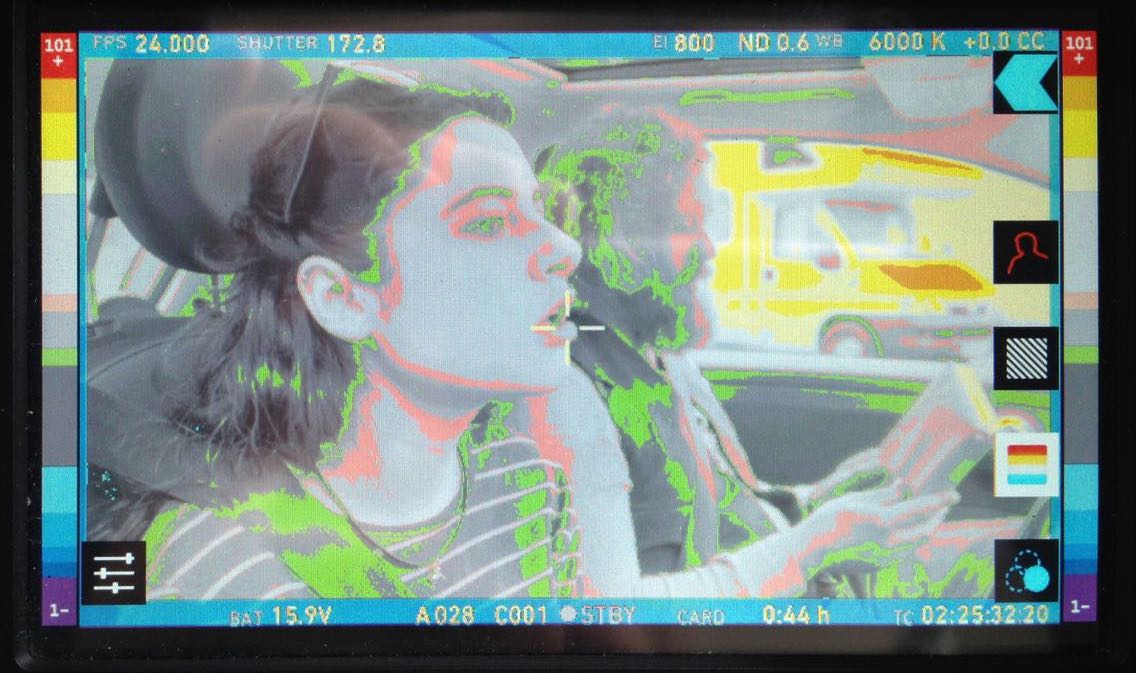
6. Zebras and false colours
Almost all cameras have zebras, a setting which superimposes diagonal stripes on parts of the image which are over a certain IRE, or within a certain range of IREs. By digging into the menus you can find and adjust what those IRE levels are. Typically zebras are used to flag up highlights which are clipping (theoretically 100 IRE), or close to clipping.
 Exposing an image correctly is not just about controlling highlight clipping however, it’s about balancing the whole range of tones – which brings us to false colours. A false colour overlay looks a little like a weather forecaster’s temperature map, with a code of colours assigned to various luminance values. Clipped highlights are typically red, while bright areas still retaining detail (known as the “knee” or “shoulder”) are yellow. Middle grey is often represented by green, while pink indicates the ideal level for caucasian skin tones (usually around 55 IRE). At the bottom end of the scale, blue represents the “toe” – the darkest area that still has detail – while purple is underexposed. The advantage of zebras and false colours over waveforms and histograms is that the former two show you exactly where the problem areas are in the frame.
I hope this article has given you a useful overview of the tools available for judging exposure. Some DPs have a single tool they rely on at all times, but many will use all of these methods at one time or another to produce an image that balances maximising detail with creative intent. I’ll leave you with a quote from the late, great Douglas Slocombe, BSC who ultimately used none of the above six methods!
I used to use a light meter – I used one for years. Through the years I found that, as schedules got tighter and tighter, I had less and less time to light a set. I found myself not checking the meter until I had finished the set and decided on the proper stop. It would usually say exactly what I thought it should. If it didn’t, I wouldn’t believe it, or I would hold it in such a way as to make it say my stop. After a time I decided this was ridiculous and stopped using it entirely. The “Raiders” pictures were all shot without a meter. I just got used to using my eyes.