Exposure Part 1: Aperture

This is the first in a series of posts where I will look in detail at the four means of controlling the brightness of a digital video image: aperture, neutral density (ND) filters, shutter angle and ISO. It is not uncommon for newer cinematographers to have only a partial understanding of these topics, enough to get by in most situations; that was certainly the case with me for many years. The aim of this series is to give you an understanding of the underlying mechanics which will enable you to make more informed creative decisions.

You can change any one of the four factors, or any combination of them, to reach your desired level of exposure. However, most of them will also affect the image in other ways; for example, aperture affects depth of field. One of the key responsibilities of the director of photography is to use each of the four factors not just to create the ideal exposure, but to make appropriate use of these “side effects” as well.


f-stops and t-stops

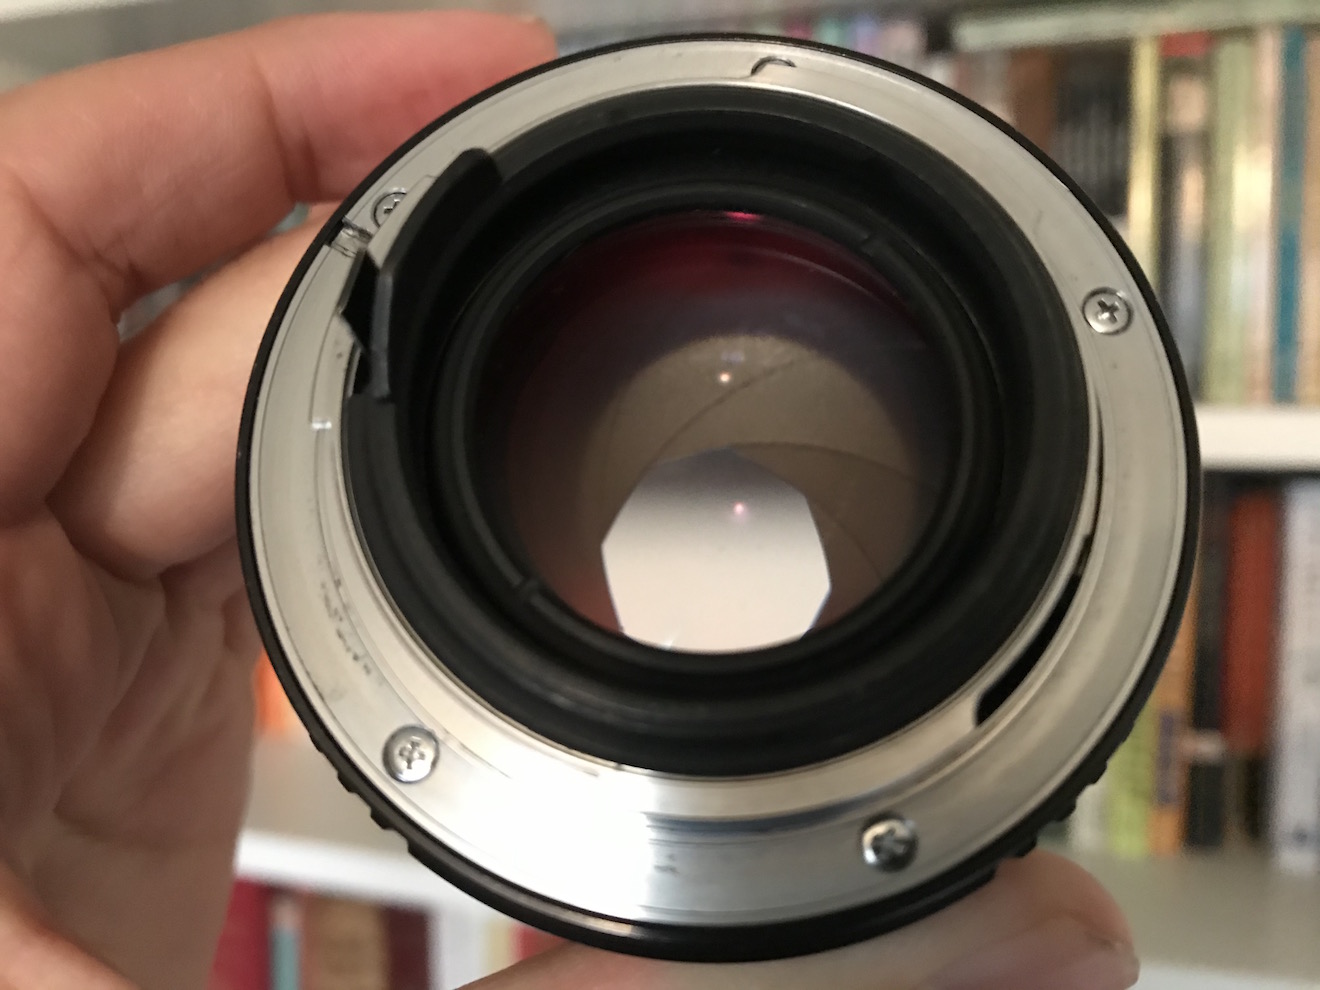
The most common way of altering exposure is to adjust the aperture, a.k.a. the iris, sometimes described as changing “the stop”. Just like the pupil in our eyes, the aperture of a photographic lens is a (roughly) circular opening which can be expanded or contracted to permit more or less light through to the sensor.

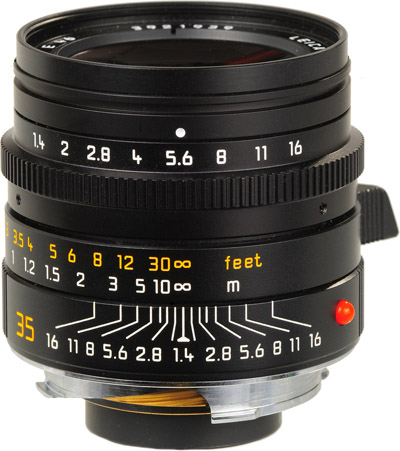
You will have seen a series of numbers like this printed on the sides of lenses:

1      1.4      2      2.8      4      5.6      8      11      16      22     32

These are ratios – ratios of the lens’ focal length to its iris diameter. So a 50mm lens with a 25mm diameter iris is at f/2. Other lengths of lens would have different iris diameters at f/2 (e.g. 10mm diameter for a 20mm lens) but they would all produce an image of the same brightness. That’s why we use f-stops to talk about iris rather than diameters.

But why not label a lens 1, 2, 3, 4…? Why 1, 1.2, 2, 2.8…? These magic numbers are f-stops. A lens set to f/1.4 will let in twice as much light as (or “one stop more than”) a lens set to f/2, which in turn will let in twice as much as one set to f/2.8, and so on. Conversely, a lens set to f/2.8 will let in half as much light as (or “one stop less than”) a lens set to f/2, and so on. (Note that a number between any of these f-stops, e.g. f/1.8, is properly called an f-number, but not an f-stop.) These doublings or halvings – technically known as a base-2 logarithmic scale – are a fundamental concept in exposure, and mimic our eyes’ response to light.

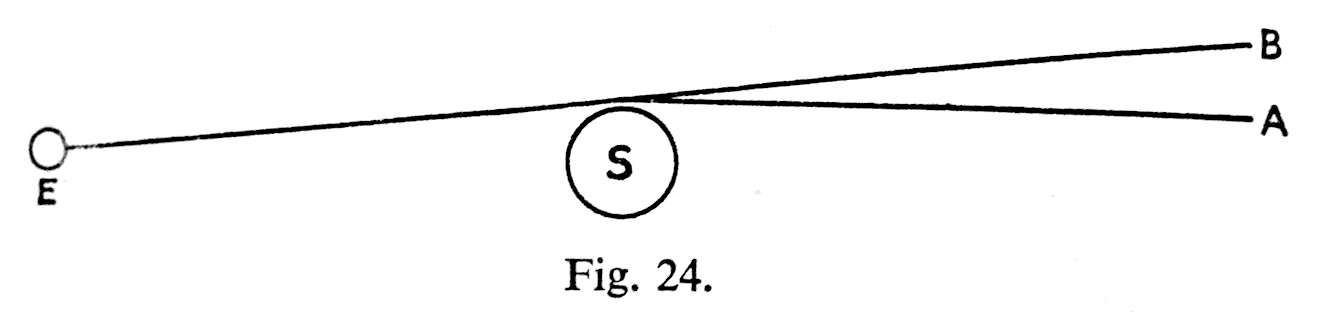
If you think back to high-school maths and the πr² squared formula for calculating the area of a circle from its radius, the reason for the seemingly random series of numbers will start to become clear. Letting in twice as much light requires twice as much area for those light rays to fall on, and remember that the f-number is the ratio of the focal length to the iris diameter, so you can see how square roots are going to get involved and why f-stops aren’t just plain old round numbers.

If you’re shooting with a cine lens, rather than a stills lens, you’ll see the same series of numbers on the barrel, but here they are T-stops rather than f-stops. T-stops are f-stops adjusted to compensate for the light transmission efficiency. Two different lenses set to, say, f/2 will not necessarily produce equally bright images, because some percentage of light travelling through the elements will always be lost, and that percentage will vary depending on the quality of the glass and the number of elements. A lens with 100% light transmission would have the same f-number and T-number, but in practice the T-number will always be a little bigger than the f-number. For example, Cooke’s 15-40mm zoom is rated at a maximum aperture of T2 or f/1.84.


Fast and slow lenses

When buying or renting a lens, one of the first things you will want to know is its maximum aperture. Lenses are often described as being fast (larger maximum aperture, denoted by a smaller f- or T-number like T1.4) or slow (smaller maximum aperture, denoted by a bigger f- or T-number like T4). These terms come from the fact that the shutter speed would need to be faster or slower to capture the same amount of light… but more on that later in the series.

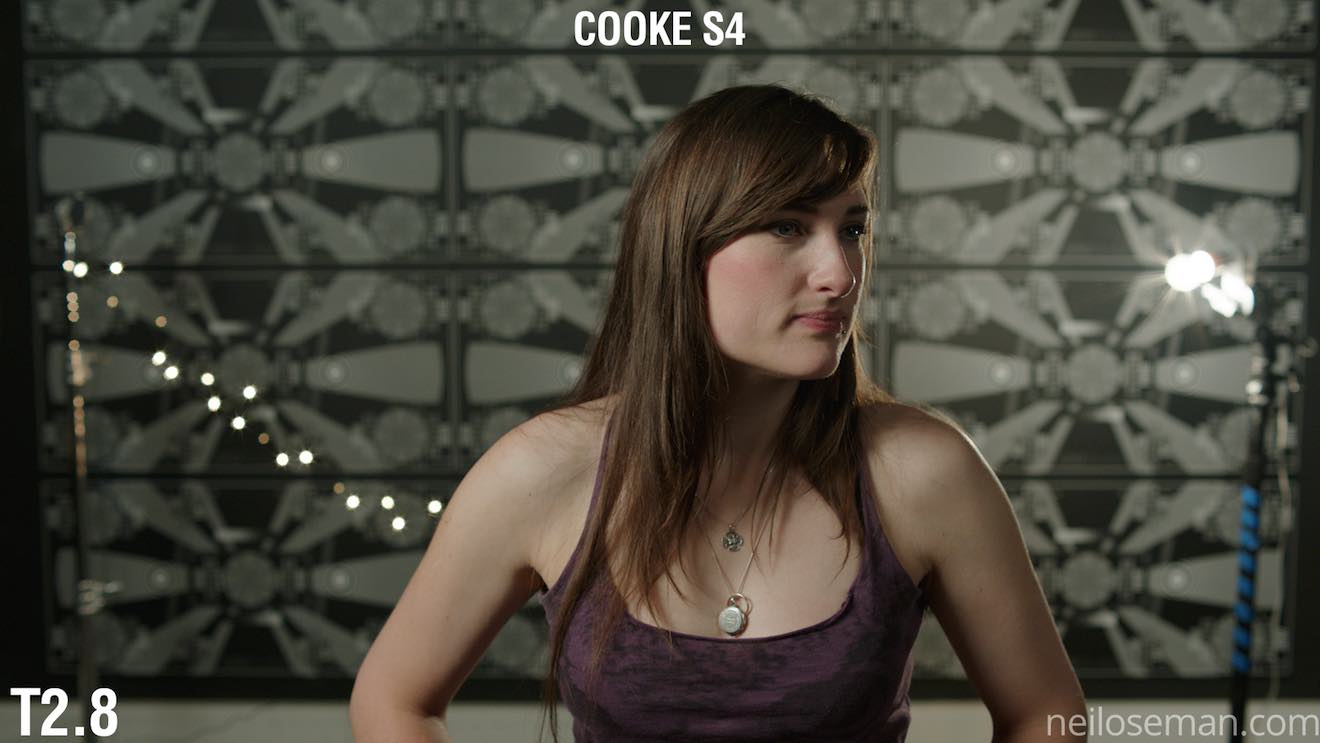
Faster lenses are generally more expensive, but that expense may well be outweighed by the savings made on lighting equipment. Let’s take a simple example, and imagine an interview lit by a 4-bank Kino Flo and exposed at T2.8. If our lens can open one stop wider (known as stopping up) to T2 then we double the amount of light reaching the sensor. We can therefore halve the level of light – by turning off two of the Kino Flo’s tubes or by renting a cheaper 2-bank unit in the first place. If we can stop up further, to T1.4, then we only need one Kino tube to achieve the same exposure.


Side effects

One of the first things that budding cinematographers learn is that wider apertures make for a smaller depth of field, i.e. the range of distances within which a subject will be in focus is smaller. In simple terms, the background of the image is blurrier when the depth of field is shallower.

It is often tempting to go for the shallowest possible depth of field, because it feels more cinematic and helps conceal shortcomings in the production design, but that is not the right look for every story. A DP will often choose a stop to shoot at based on the depth of field they desire. That choice of stop may affect the entire lighting budget; if you want to shoot at a very slow T14 like Douglas Slocombe did for the Indiana Jones trilogy, you’re going to need several trucks full of lights!

There is another side effect of adjusting the aperture which is less obvious. Lenses are manufactured to perform best in the middle of their iris range. If you open a lens up to its maximum aperture or close it down to its minimum, the image will soften a little. Therefore another advantage of faster lenses is the ability to get further away from their maximum aperture (and poorest image quality) with the same amount of light.

Finally it is worth noting that the appearance of bokeh (out of focus areas) and lens flares also changes with aperture. The Cooke S4 range, for example, renders out-of-focus highlights as circles when wide open, but as octagons when stopped down. With all lenses, the star pattern seen around bright light sources will be stronger when the aperture is smaller. You should shoot tests – like these I conducted in 2017 – if these image artefacts are a critical part of your film’s look.

Next time we’ll look at how we can use ND filters to control exposure without compromising our choice of stop.

Learn how to use exposure practically with my Cinematic Lighting online couse. Enter voucher code INSTA90 for an amazing 90% off.

Exposure Part 1: Aperture

Colour Rendering Index

Many light sources we come across today have a CRI rating. Most of us realise that the higher the number, the better the quality of light, but is it really that simple? What exactly is Colour Rendering Index, how is it measured and can we trust it as cinematographers? Let’s find out.


What is C.R.I.?

CRI was created in 1965 by the CIE – Commission Internationale de l’Eclairage – the same body responsible for the colour-space diagram we met in my post about How Colour Works. The CIE wanted to define a standard method of measuring and rating the colour-rendering properties of light sources, particularly those which don’t emit a full spectrum of light, like fluorescent tubes which were becoming popular in the sixties. The aim was to meet the needs of architects deciding what kind of lighting to install in factories, supermarkets and the like, with little or no thought given to cinematography.

As we saw in How Colour Works, colour is caused by the absorption of certain wavelengths of light by a surface, and the reflection of others. For this to work properly, the light shining on the surface in the first place needs to consist of all the visible wavelengths. The graphs below show that daylight indeed consists of a full spectrum, as does incandescent lighting (e.g. tungsten), although its skew to the red end means that white-balancing is necessary to restore the correct proportions of colours to a photographed image. (See my article on Understanding Colour Temperature.)

Fluorescent and LED sources, however, have huge peaks and troughs in their spectral output, with some wavelengths missing completely. If the wavelengths aren’t there to begin with, they can’t reflect off the subject, so the colour of the subject will look wrong.

Analysing the spectrum of a light source to produce graphs like this required expensive equipment, so the CIE devised a simpler method of determining CRI, based on how the source reflected off a set of eight colour patches. These patches were murky pastel shades taken from the Munsell colour wheel (see my Colour Schemes post for more on colour wheels). In 2004, six more-saturated patches were added.

The maths which is used to arrive at a CRI value goes right over my head, but the testing process boils down to this:

  1. Illuminate a patch with daylight (if the source being tested has a correlated colour temperature of 5,000K or above) or incandescent light (if below 5,000K).
  2. Compare the colour of the patch to a colour-space CIE diagram and note the coordinates of the corresponding colour on the diagram.
  3. Now illuminate the patch with the source being tested.
  4. Compare the new colour of the patch to the CIE diagram and note the coordinates of the corresponding colour.
  5. Calculate the distance between the two sets of coordinates, i.e. the difference in colour under the two light sources.
  6. Repeat with the remaining patches and calculate the average difference.

Here are a few CRI ratings gleaned from around the web:

Source CRI
Sodium streetlight -44
Standard fluorescent 50-75
Standard LED 83
LitePanels 1×1 LED 90
Arri HMI 90+
Kino Flo 95
Tungsten 100 (maximum)


Problems with C.R.I.

There have been many criticisms of the CRI system. One is that the use of mean averaging results in a lamp with mediocre performance across all the patches scoring the same CRI as a lamp that does terrible rendering of one colour but good rendering of all the others.

Demonstrating the non-continuous spectrum of a fluorescent lamp, versus the continuous spectrum of incandescent, using a prism.

Further criticisms relate to the colour patches themselves. The eight standard patches are low in saturation, making them easier to render accurately than bright colours. An unscrupulous manufacturer could design their lamp to render the test colours well without worrying about the rest of the spectrum.

In practice this all means that CRI ratings sometimes don’t correspond to the evidence of your own eyes. For example, I’d wager that an HMI with a quoted CRI in the low nineties is going to render more natural skin-tones than an LED panel with the same rating.

I prefer to assess the quality of a light source by eye rather than relying on any quoted CRI value. Holding my hand up in front of an LED fixture, I can quickly tell whether the skin tones looks right or not. Unfortunately even this system is flawed.

The fundamental issue is the trichromatic nature of our eyes and of cameras: both work out what colour things are based on sensory input of only red, green and blue. As an analogy, imagine a wall with a number of cracks in it. Imagine that you can only inspect it through an opaque barrier with three slits in it. Through those three slits, the wall may look completely unblemished. The cracks are there, but since they’re not aligned with the slits, you’re not aware of them. And the “slits” of the human eye are not in the same place as the slits of a camera’s sensor, i.e. the respective sensitivities of our long, medium and short cones do not quite match the red, green and blue dyes in the Bayer filters of cameras. Under continuous-spectrum lighting (“smooth wall”) this doesn’t matter, but with non-continuous-spectrum sources (“cracked wall”) it can lead to something looking right to the eye but not on camera, or vice-versa.


Conclusion

Given its age and its intended use, it’s not surprising that CRI is a pretty poor indicator of light quality for a modern DP or gaffer. Various alternative systems exist, including GAI (Gamut Area Index) and TLCI (Television Lighting Consistency Index), the latter similar to CRI but introducing a camera into the process rather than relying solely on human observation. The Academy of Motion Picture Arts and Sciences recently invented a system, Spectral Similarity Index (SSI), which involves measuring the source itself with a spectrometer, rather than reflected light. At the time of writing, however, we are still stuck with CRI as the dominant quantitative measure.

So what is the solution? Test, test, test. Take your chosen camera and lens system and shoot some footage with the fixtures in question. For the moment at least, that is the only way to really know what kind of light you’re getting.

SaveSave

SaveSaveSaveSave

SaveSave

SaveSave

SaveSave

SaveSave

SaveSave

SaveSave

SaveSave

SaveSave

Colour Rendering Index

9 Fun Photic Facts from a 70-year-old Book

Shortly before Christmas, while browsing the secondhand books in the corner of an obscure Herefordshire garden centre, I came across a small blue hardback called The Tricks of Light and Colour by Herbert McKay. Published in 1947, the book covered almost every aspect of light you could think of, from the inverse square law to camouflage and optical illusions. What self-respecting bibliophile cinematographer could pass that up?

Here are some quite-interesting things about light which the book describes…


1. SPHERES ARE THE KEY to understandING the inverse square law.

Any cinematographer worth their salt will know that doubling a subject’s distance from a lamp will quarter their brightness; tripling their distance will cut their brightness to a ninth; and so on.  This, of course, is the inverse square law. If you struggle to visualise this law and why it works the way it does, The Tricks of Light and Colour offers a good explanation.

[Think] of light being radiated from… a mere point. Light and heat are radiated in straight lines and in all directions [from this point]. At a distance of one foot from the glowing centre the whole quantity of light and heat is spread out over the surface of a sphere with a radius of one foot. At a distance of two feet from the centre it is spread over the surface of a sphere of radius two feet. Now to find an area we multiply two lengths; in the case of a sphere both lengths are the radius of the sphere. As both lengths are doubled the area is four times as great… We have the same amounts of light and heat spread over a sphere four times as great, and so the illumination and heating effect are reduced to a quarter as great.


2. MIRAGES ARE DUE TO Total internal reflection.

This is one of the things I dimly remember being taught in school, which this book has considerably refreshed me on. When light travels from one transparent substance to another, less dense, transparent substance, it bends towards the surface. This is called refraction, and it’s the reason that, for example, streams look shallower than they really are, when viewed from the bank. If the first substance is very dense, or the light ray is approaching the surface at a glancing angle, the ray might not escape at all, instead bouncing back down. This is called total internal reflection, and it’s the science behind mirages.

The heated sand heats the air above it, and so we get an inversion of the density gradient: low density along the heated surface, higher density in the cooler air above. Light rays are turned down, and then up, so that the scorched and weary traveller sees an image of the sky, and the images looks like a pool of cool water on the face of the desert.


3. Pinhole images pop up in unexpected places.

Most of us have made a pinhole camera at some point in our childhood, creating an upside-down image on a tissue paper screen by admitting light rays through a tiny opening. Make the opening bigger and the image becomes a blur, unless you have a lens to focus the light, as in a “proper” camera or indeed our eyes. But the pinhole imaging effect can occur naturally too. I’ve sometimes lain in bed in the morning, watching images of passing traffic or flapping laundry on a line projected onto my bedroom ceiling through the little gap where the curtains meet at the top. McKay describes another example:

One of the prettiest examples of the effect may be seen under trees when the sun shines brightly. The ground beneath a tree may be dappled with circles of light, some of them quite bright… When we look up through the leaves towards the sun we may see the origin of the circles of light. We can see points of light where the sun shines through small gaps between the leaves. Each of these gaps acts in the same way as a pinhole: it lets through rays from the sun which produce an image of the sun on the ground below.


4. The sun isn’t a point source.

“Shadows are exciting,” McKay enthuses as he opens chapter VI. They certainly are to a cinematographer. And this cinematographer was excited to learn something about the sun and its shadow which is really quite obvious, but I had never considered before.

Look at the shadow of a wall. Near the base, where the shadow begins, the edge of the shadow is straight and sharp… Farther out, the edge of the shadow gets more and more fuzzy… The reason lies of course in the great sun itself. The sun is not a mere point of light, but a globe of considerable angular width.

The accompanying illustration shows how you would see all, part or none of the sun if you stood in a slightly different position relative to the hypothetical wall. The area where none of the sun is visible is of course in full shadow (umbra), and the area where the sun is partially visible is the fuzzy penumbra (the “almost shadow”).


5. Gravity bends LIGHT.

Einstein hypothesised that gravity could bend light rays, and observations during solar eclipses proved him right. Stars near to the eclipsed sun were seen to be slightly out of place, due to the huge gravitational attraction of the sun.

The effect is very small; it is too small to be observed when the rays pass a comparatively small body like the moon. We need a body like the sun, at whose surface gravity is 160 or 170 times as great as at the surface of the moon, to give an observable deviation…. The amount of shift depends on the apparent nearness of a star to the sun, that is, the closeness with which the rays of light from the star graze the sun. The effect of gravity fades out rapidly, according to the inverse square law, so that it is only near the sun that the effects can be observed.


6. Light helped us discover helium.

Sodium street-lamps are not the most pleasant of sources, because hot sodium vapour emits light in only two wave-lengths, rather than a continuous spectrum. Interestingly, cooler sodium vapour absorbs the same two wave-lengths. The same is true of other elements: they  emit certain wave-lengths when very hot, and absorb the same wave-lengths when less hot. This little bit of science led to a major discovery.

The sun is an extremely hot body surrounded by an atmosphere of less highly heated vapours. White light from the sun’s surfaces passes through these heated vapours before it reaches us; many wave-lengths are absorbed by the sun’s atmosphere, and there is a dark line in the spectrum for each wave-length that has been absorbed. The thrilling thing is that these dark lines tell us which elements are present in the sun’s atmosphere. It turned out that the lines in the sun’s spectrum represented elements already known on the earth, except for one small group of lines which were ascribed to a hitherto undetected element. This element was called helium (from helios, the sun).


7. Moonlight is slightly too dim for colours.

Our retinas are populated by two different types of photoreceptors: rods and cones. Rods are much more sensitive than cones, and enable us to see in very dim light once they’ve had some time to adjust. But rods cannot see colours. This is why our vision is almost monochrome in dark conditions, even under the light of a full moon… though only just…

The light of the full moon is just about the threshold, as we say, of colour vision; a little lighter and we should see colours.


8. MAGIC HOUR can be longer than an hour.

We cinematographers often think of magic “hour” as being much shorter than an hour. When prepping for a dusk-for-night scene on The Little Mermaid, I used my light meter to measure the length of shootable twilight. The result was 20 minutes; after that, the light was too dim for our Alexas at 800 ISO and our Cooke S4 glass at T2. But how long after sunset is it until there is literally no light left from the sun, regardless of how sensitive your camera is? McKay has this to say…

Twilight is partly explained as an effect of diffusion. When the sun is below the horizon it still illuminates particles of dust and moisture in the air. Some of the scattered light is thrown down to the earth’s surface… Twilight ends when the sun is 17° or 18° below the horizon. At the equator [for example] the sun sinks vertically at the equinoxes, 15° per hour; so it sinks 17° in 1 hour 8 minutes.


9. Why isn’t Green a primary colour in paint?

And finally, the answer to something that bugged me during my childhood. When I was a small child, daubing crude paintings of stick figures under cheerful suns, I was taught that the primary colours are red, blue and yellow. Later I learnt that the true primary colours, the additive colours of light, are red, blue and green. So why is it that green, a colour that cannot be created by mixing two other colours of light, can be created by mixing blue and yellow paints?

When white light falls on a blue pigment, the pigment absorbs reds and yellows; it reflects blue and also some green. A yellow pigment absorbs blue and violet; it reflects yellow, and also some red and green which are the colours nearest to it in the spectrum. When the two pigments are mixed it may be seen that all the colours are absorbed by one or other of the components except green.


If you’re interested in picking up a copy of The Tricks of Light and Colour yourself, there is one on Amazon at the time of writing, but it will set you back £35. Note that Herbert McKay is not to be confused with Herbert C. McKay, an American author who was writing books about stereoscopic photography at around the same time.

9 Fun Photic Facts from a 70-year-old Book

Choosing an ND Filter: f-stops, T-stops and Optical Density

A revised and updated version of this article can be found here (aperture) and here (ND filters).

Imagine this scenario. I’m lensing a daylight exterior and my light meter gives me a reading of f/11, but I want to shoot with an aperture of T4, because that’s the depth of field I like. I know that I need to use a .9 ND (neutral density) filter. But how did I work that out? How on earth does anyone arrive at the number 0.9 from the numbers 11 and 4?

Let me explain from the beginning. First of all, let’s remind ourselves what f-stops are. You have probably seen those familiar numbers printed on the sides of lenses many times…

1      1.4      2      2.8      4      5.6      8      11      16      22

They are ratios: ratios of the lens’ focal length to its iris diameter. So a 50mm lens with a 25mm diameter iris is at f/2. If you close up the iris to just under 9mm in diameter, you’ll be at f/5.6 (50 divided by 5.6 is 8.93).

A stills lens with its aperture ring marked in f-stops
A stills lens with its aperture ring (top) marked in f-stops

But why not label a lens 1, 2, 3, 4? Why 1, 1.2, 2, 2.8…? These magic numbers are f-stops. A lens set to f/1 will let in twice as much light as (or ‘one stop more than’) one set to f/1.4, which in turn will let in twice as much as one set to f/2, and so on. Conversely, a lens set to f/2 will let in half as much light as (or ‘one stop less than’) one set to f/1.4, and so on.


If you think back to high school maths and the Pi r squared formula for calculating the area of a circle from its radius, the reason for the seemingly random series of numbers will start to become clear. Letting in twice as much light requires twice as much area for those light rays to fall on, and remember that the f-number is the ratio of the focal length to the iris diameter, so you can see how square roots are going to get involved and why f-stops aren’t just plain old round numbers.

A Zeiss Compact Prime lens with its aperture ring marked in T-stops

Now, earlier I mentioned T4. How did I get from f-stops to T-stops? Well, T-stops are f-stops adjusted to compensate for the light transmission efficiency. Two different f/2 lenses will not necessarily produce equally bright images, because some percentage of light travelling through the elements will always be lost, and that percentage will vary depending on the quality of the glass and the number of elements. A lens with 100% light transmission would have the same f-number and T-number, but in practice the T-number will always be a little higher than the f-number. For example, Cooke’s 15-40mm zoom is rated at a maximum aperture of T2 or f/1.84.

So, let’s go back to my original scenario and see where we are. My light meter reads f/11. However,  I expressed my target stop as a T-number though, T4, because I’m using cinema lenses and they’re marked up in T-stops rather than f-stops. (I can still use the f-number my meter gives me though; in fact if my lens were marked in f-stops then my exposure would be slightly off because the meter does not know the transmission efficiency of my lens.)

By looking at the series of f-numbers permanently displayed on my light meter (the same series listed near the top of this post, or on any lens barrel) I can see that f/11 (or T11) is 3 stops above f/4 (or T4) – because 11 is three numbers to the right of 4 in the series. I can often be seen on set counting the stops like this on my light meter or on my fingers. It is of course possible to work it out mathematically, but screw that!

CameraZOOM-20140309092150072_zps94e90ea4
A set of Tiffen 4×4″ ND filters

So I need an ND filter that cuts 3 stops of light. But we’re not out of the mathematical woods yet.

The most popular ND filters amongst professional cinematographers are those made by Tiffen, and a typical set might be labelled as follows:

.3      .6      .9      1.2

Argh! What do those numbers mean? That’s the optical density, a property defined as the natural logarithm of the ratio of the quantity of light entering the filter to the quantity of light exiting it on the other side. A .3 ND reduces the light by half because 10 raised to the power of -0.3 is 0.5, or near as damn it. And reducing light by half, as we established earlier, means dropping one stop.

If that fries your brain, don’t worry; it does mine too. All you really need to do is multiply the number of stops you want to drop by 0.3 to find the filter you need. So to drop three stops you pick the .9 ND.

And that’s why you need a .9 ND to shoot at T4 when your light meter says f/11. Clear as mud, right? Once you get your head around it, and memorise the f-stops, this all becomes a lot easier than it seems at first glance.

Here are a couple more examples:

  • Light meter reads f/8 and you want to shoot at T5.6. That’s a one stop difference. (5.6 and 8 are right next to each other in the stop series, as you’ll see if you scroll back to the top.) 1 x 0.3 = 0.3 so you should use the .3 ND.
  • Light meter reads f/22 and you want to shoot at T2.8. That’s a six stop difference (scroll back up and count them), and 6 x 0.3 = 1.8, so you need a 1.8 ND filter. If you don’t have one, you need to stack two NDs in your matte box that add up to 1.8, e.g. a 1.2 and a .6.


Choosing an ND Filter: f-stops, T-stops and Optical Density